The Big Macro Nowcasting Ranking
The objective of this page is to maintain and populate the ranking below, with newly introduced statistical models in an effort to provide a continuously updated comprehensive comparison of methodologies for nowcasting and forecasting macroeconomic activity. The model comparison is based on a set of (pseudo) real-time vintages, formed using a rich standardized set of variables at mixed-frequencies.
The performance evaluation currently covers US real GDP growth rate (QoQ%), comparing 20 distinct methodologies (including 14 Machine Learning algorithms, as well as standard econometric techniques and workhorse benchmarks), which are combined with three data transformations (D1,D2,D3) for taking into account the mixed-frequency dimension. This results into a ranking containing a total of 85 specifications.
Dataset
The dataset consists of 87 quarterly, and 171 monthly (including 32 financial market) indicators. The indicators correspond to the series found in the FRED-MD and -QD datasets and were downloaded at their original (i.e. highest-available) sampling frequency, whenever possible. Publication release delays were inferred from the metadata in the FRED database (https://fred.stlouisfed.org) and then applied to each series to mimic the ragged-edge structure the forecaster would face in reality. The out-of-sample evaluation exercise uses end-of-month vintages at a monthly periodicity, assuming that economic activity is monitored in real-time by updating the projections at the end of every month.
A list of the indicators that compose the mixed-frequency dataset, can be accessed here. ‘SeriesID’ refers to the FRED mnemonic, while the release delay (‘RDelay’) measures the approximate number of days it takes for the respective indicator to be released after the closing of the reference month or quarter. The monthly mixed-frequency vintages used in the POOS model evaluation can be downloaded here. The full set consists of 376 end-of-month vintages spanning the period 19900131-20210430, including monthly and quarterly unbalanced panels whose ragged edge has been imposed by applying the inferred publication delays.
List of forecasting models
| Acronym | Model Description |
|---|---|
| AR(P) | Autoregressive iterated-specification |
| RW | Random walk |
| ARDI(K,BIC) | Autoregressive diffusion indices with K factors. Optimal lag-order via BIC |
| T.ARDI(K,BIC) | ARDI with target-factors. Hard-threshold set to |t-stat|>1.96 |
| BVAR-Minn | Homoscedastic large Bayesian VAR |
| BVAR-CSV | Large Bayesian VAR with heteroscedastic innovations |
| BBoost | L2 boosting with linear base learner, block-wise lag treatment |
| CBoost | L2 boosting with linear base learner, component-wise lag treatment |
| CSR | Complete Subset Regressions (20C4) with hard-thresholding preselection |
| Bag | Bagging dynamic linear regressions (with preselection) |
| BTree | Boosting regression trees |
| RF | Random forests |
| SVR | Support vector machine regression with Gaussian Kernel function |
| Ridge | Ridge regression |
| LASSO | Least absolute shrinkage and selection operator with BIC for lambda |
| AdaLASSO | Adaptive LASSO |
| EN | Elastic Net |
| AdaEN | Adaptive EN |
| LSTM | Long-short-term memory RNN with 3-hidden layers |
| SgLASSO | Sparse-group-LASSO-MIDAS with block-K-fold CV for lambda & alpha |
List of methods for treating mixed-frequencies
| Acronym | Transformation Description |
|---|---|
| D1 | Down-sampling to Quarterly (Temporal aggregation with equal-weights) |
| D2 | Unrestricted (MIDAS) Lag Polynomials |
| D3 | Aggregation with Legendre Polynomials (3rd degree) |
The Ranking: Real-time model evaluation
The table reports RMSE’s relative to the AR(1) benchmark for the n-quarters ahead prediction, with n=0 reflecting the nowcast. The models have been ranked wrt the last column which corresponds to the average relative RMSE over all 5 horizons. The real-time POOS evaluation is based on 219 monthly vintages over the period Jan-2003 to Mar-2021. D1 denotes single-frequency information set; D2 Unrestricted (U-MIDAS) lag polynomials; and D3 Legendre-aggregated mixed-frequency information set. The table ranks specifications coming from the different combinations of ML models with all the transformations D1, D2 and D3 plus their factor-only counterparts. Models with an acronym ending in ‘F’ contain only factors on the RHS.
| Models | n=0 | n=1 | n=2 | n=3 | n=4 | avg |
|---|---|---|---|---|---|---|
| Bag-D3 | 0.728 | 0.932 | 0.972 | 0.998 | 0.994 | 0.925 |
| CSR-D2 | 0.707 | 0.938 | 0.976 | 1 | 1.004 | 0.925 |
| BBoost-D1F | 0.725 | 0.925 | 0.978 | 1.006 | 1.001 | 0.927 |
| Bag-D2F | 0.772 | 0.91 | 0.967 | 0.994 | 0.999 | 0.929 |
| Ridge-D1 | 0.764 | 0.924 | 0.958 | 0.996 | 1.001 | 0.929 |
| Ridge-D2 | 0.742 | 0.926 | 0.972 | 1.001 | 1.005 | 0.929 |
| Bag-D2 | 0.767 | 0.921 | 0.969 | 0.993 | 1.002 | 0.93 |
| T.ARDI(2) | 0.745 | 0.929 | 0.975 | 1.002 | 1.007 | 0.932 |
| Bag-D1F | 0.759 | 0.925 | 0.97 | 1.005 | 1.001 | 0.932 |
| Bag-D1 | 0.783 | 0.918 | 0.961 | 0.996 | 1.002 | 0.932 |
| CSR-D1 | 0.758 | 0.934 | 0.974 | 1.004 | 1.009 | 0.936 |
| Ridge-D3 | 0.791 | 0.921 | 0.969 | 1.004 | 1.003 | 0.938 |
| RF-D1F | 0.816 | 0.917 | 0.966 | 0.995 | 0.992 | 0.938 |
| Ridge-D2F | 0.808 | 0.913 | 0.968 | 0.999 | 1.004 | 0.938 |
| CBoost-D1F | 0.773 | 0.925 | 0.983 | 1.01 | 1.001 | 0.938 |
| SVR-D1 | 0.825 | 0.919 | 0.964 | 0.992 | 0.995 | 0.939 |
| LASSO-D1F | 0.787 | 0.93 | 0.978 | 1.002 | 0.999 | 0.939 |
| AdaLASSO-D1F | 0.781 | 0.937 | 0.98 | 1.003 | 0.998 | 0.94 |
| RF-D1 | 0.804 | 0.924 | 0.971 | 0.999 | 1.003 | 0.94 |
| Bag-D3F | 0.816 | 0.917 | 0.972 | 1.005 | 0.993 | 0.941 |
| EN-D2F | 0.816 | 0.921 | 0.969 | 0.999 | 1.001 | 0.941 |
| EN-D1F | 0.799 | 0.928 | 0.978 | 1.001 | 1 | 0.941 |
| SVR-D3 | 0.827 | 0.92 | 0.97 | 0.995 | 0.997 | 0.942 |
| RF-D3 | 0.812 | 0.936 | 0.969 | 0.994 | 1.001 | 0.942 |
| ARDI(1) | 0.799 | 0.939 | 0.975 | 0.999 | 1.001 | 0.943 |
| CBoost-D2F | 0.821 | 0.92 | 0.965 | 0.999 | 1.008 | 0.943 |
| BBoost-D2F | 0.836 | 0.912 | 0.967 | 0.998 | 1 | 0.943 |
| SVR-D3F | 0.831 | 0.914 | 0.972 | 0.995 | 1.001 | 0.943 |
| SVR-D2 | 0.828 | 0.923 | 0.971 | 0.997 | 0.997 | 0.943 |
| AdaEN-D2 | 0.766 | 0.947 | 0.977 | 1.003 | 1.024 | 0.943 |
| EN-D2 | 0.777 | 0.971 | 0.978 | 0.996 | 0.994 | 0.943 |
| RF-D2 | 0.816 | 0.925 | 0.976 | 1.001 | 1 | 0.943 |
| LASSO-D2F | 0.831 | 0.92 | 0.969 | 0.998 | 1 | 0.944 |
| AdaEN-D1F | 0.802 | 0.934 | 0.981 | 1.002 | 1 | 0.944 |
| SVR-D1F | 0.827 | 0.921 | 0.971 | 0.999 | 1 | 0.944 |
| CSR-D2F | 0.824 | 0.928 | 0.97 | 0.997 | 1 | 0.944 |
| SVR-D2F | 0.831 | 0.925 | 0.972 | 0.996 | 0.995 | 0.944 |
| RF-D2F | 0.827 | 0.929 | 0.972 | 0.998 | 0.995 | 0.944 |
| BTree-D1F | 0.811 | 0.923 | 0.975 | 1.002 | 1.008 | 0.944 |
| AdaEN-D2F | 0.834 | 0.926 | 0.965 | 0.999 | 1.002 | 0.945 |
| AdaLASSO-D2F | 0.84 | 0.922 | 0.966 | 0.998 | 1.001 | 0.945 |
| AdaLASSO-D2 | 0.765 | 0.954 | 0.979 | 0.998 | 1.034 | 0.946 |
| LSTM-D1F | 0.845 | 0.918 | 0.968 | 1.005 | 0.994 | 0.946 |
| ARDI(2) | 0.798 | 0.947 | 0.978 | 1.001 | 1.008 | 0.946 |
| EN-D3 | 0.834 | 0.924 | 0.975 | 1 | 1 | 0.947 |
| CSR-D3 | 0.814 | 0.931 | 0.98 | 1.005 | 1.003 | 0.947 |
| RW | 0.839 | 0.921 | 0.975 | 0.999 | 0.999 | 0.947 |
| LSTM-D2F | 0.844 | 0.928 | 0.966 | 1 | 0.997 | 0.947 |
| LASSO-D2 | 0.78 | 0.98 | 0.983 | 1 | 0.997 | 0.948 |
| BVAR-CSV | 0.811 | 0.926 | 0.98 | 1.012 | 1.013 | 0.948 |
| RF-D3F | 0.844 | 0.934 | 0.976 | 0.991 | 1.001 | 0.949 |
| T.ARDI(1) | 0.814 | 0.948 | 0.975 | 1.005 | 1.007 | 0.95 |
| AdaEN-D1 | 0.817 | 0.931 | 0.991 | 1.007 | 1.003 | 0.95 |
| BBoost-D3F | 0.865 | 0.906 | 0.973 | 1.006 | 1.001 | 0.95 |
| AdaEN-D3 | 0.848 | 0.928 | 0.976 | 1 | 1.002 | 0.951 |
| LSTM-D3F | 0.851 | 0.926 | 0.972 | 0.994 | 1.013 | 0.951 |
| SgLASSO-D3 | 0.849 | 0.925 | 0.978 | 1.003 | 1.005 | 0.952 |
| SgLASSO-D3F | 0.861 | 0.912 | 0.977 | 1.011 | 1.003 | 0.953 |
| CSR-D1F | 0.877 | 0.925 | 0.97 | 0.998 | 0.999 | 0.954 |
| EN-D1 | 0.809 | 0.936 | 0.944 | 1.045 | 1.036 | 0.954 |
| BTree-D1 | 0.812 | 0.933 | 0.988 | 1.015 | 1.024 | 0.955 |
| AdaEN-D3F | 0.883 | 0.924 | 0.968 | 1.001 | 0.999 | 0.955 |
| LSTM-D3 | 0.858 | 0.932 | 0.978 | 1.005 | 1.004 | 0.955 |
| BVAR-Minn | 0.85 | 0.933 | 0.974 | 1.012 | 1.015 | 0.957 |
| EN-D3F | 0.891 | 0.926 | 0.971 | 1 | 0.999 | 0.957 |
| CBoost-D3F | 0.854 | 0.936 | 0.985 | 1.013 | 1.001 | 0.958 |
| LSTM-D1 | 0.866 | 0.936 | 0.978 | 1.002 | 1.013 | 0.959 |
| CSR-D3F | 0.89 | 0.938 | 0.97 | 1.001 | 0.997 | 0.959 |
| LASSO-D3F | 0.903 | 0.921 | 0.971 | 1 | 1.003 | 0.96 |
| AdaLASSO-D3F | 0.893 | 0.929 | 0.971 | 1.003 | 1.004 | 0.96 |
| BTree-D2F | 0.85 | 0.954 | 0.991 | 1.017 | 0.997 | 0.962 |
| LSTM-D2 | 0.868 | 0.943 | 0.986 | 1.017 | 0.999 | 0.962 |
| BTree-D2 | 0.839 | 0.952 | 0.994 | 1.012 | 1.016 | 0.963 |
| Ridge-D3F | 0.802 | 0.941 | 1.017 | 1.046 | 1.033 | 0.968 |
| AdaLASSO-D1 | 0.83 | 0.947 | 1.019 | 1.037 | 1.022 | 0.971 |
| BTree-D3 | 0.851 | 0.988 | 0.99 | 1.016 | 1.021 | 0.973 |
| Ridge-D1F | 0.779 | 0.959 | 1.026 | 1.06 | 1.054 | 0.976 |
| LASSO-D3 | 0.832 | 0.932 | 1.018 | 1.06 | 1.056 | 0.98 |
| AdaLASSO-D3 | 0.834 | 0.945 | 1.03 | 1.065 | 1.06 | 0.987 |
| LASSO-D1 | 0.774 | 1.007 | 0.987 | 1.102 | 1.074 | 0.989 |
| BTree-D3F | 0.88 | 1.031 | 0.999 | 1.01 | 1.033 | 0.991 |
| AR(BIC) | 1.008 | 1.003 | 1 | 1.001 | 1 | 1.002 |
| AR(CV) | 1.02 | 1.004 | 1 | 1.001 | 0.999 | 1.005 |
| AR(4) | 1.049 | 1.017 | 1.002 | 0.999 | 0.999 | 1.013 |
| AR(1) | NaN | NaN | NaN | NaN | NaN | NaN |
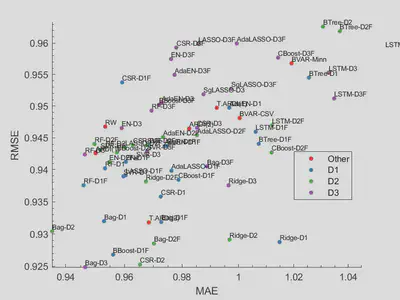
The graph provides a visualization of the horse race. Furthermore, it adds a second crucial metric for measuring comparative performance, the MAE. The axes show the relative error measures (RMSE and MAE) averaged over all 5 horizons. Candidate models that are closest to the origin (-bottom left) are the best performers.